Elliott Wave Analysis Expects GBPUSD to Pullback in Wave 2

Short Term Elliott Wave in (GBPUSD) suggests rally from 4.22.2024 low unfolded as a 5 waves impulse Elliott Wave structure. Up from 4.22.2024 low, wave ((i)) ended at 1.2635 and pullback in wave ((ii)) ended at 1.2445. The pair extends higher again in wave ((iii)) with internal subdivision as an impulse in lesser degree. The 1 hour chart below shows the subdivision of wave ((iii)).
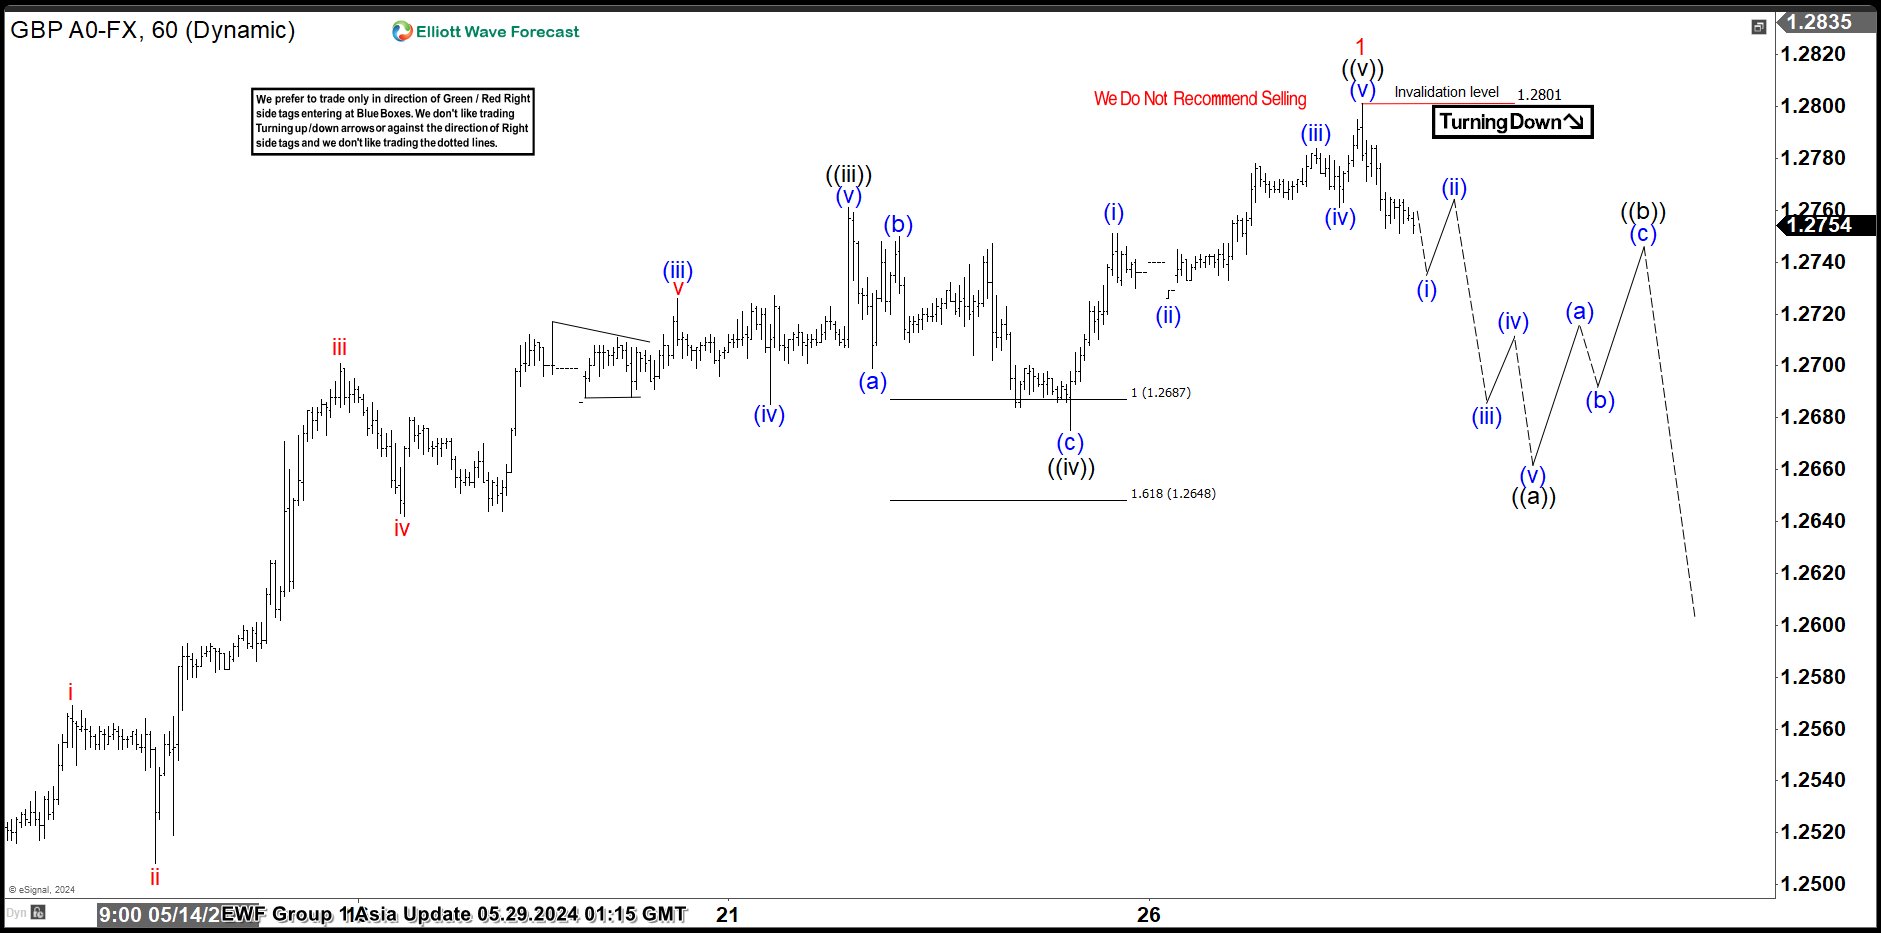
Up from wave ((ii)), wave (i) ended at 1.2541 and dips in wave (ii) ended at 1.2502. GBPUSD then extended higher in wave (iii) towards 1.2726 and pullback in wave (iv) ended at 1.2685. Final leg wave (v) ended at 1.2761 which completed wave ((iii)). The pair then pullback in wave ((iv)) towards 1.2675 and extended higher in wave ((v)) to end at 1.2801 high completing wave 1 in higher degree. Near term, as far as pivot at 1.2801 high stays intact, expect dips to find support in 3, 7 or 11 swing pullback to end wave 2 correction before further upside.
GBPUSD 60 Minutes Elliott Wave Chart
Source: https://elliottwave-forecast.com/forex/elliott-wave-analysis-expects-gbpusd-to-pullback-in-wave-2/
On the date of publication, Elliott Wave Forecast did not have (either directly or indirectly) positions in any of the securities mentioned in this article. All information and data in this article is solely for informational purposes. For more information please view the Barchart Disclosure Policy here.
